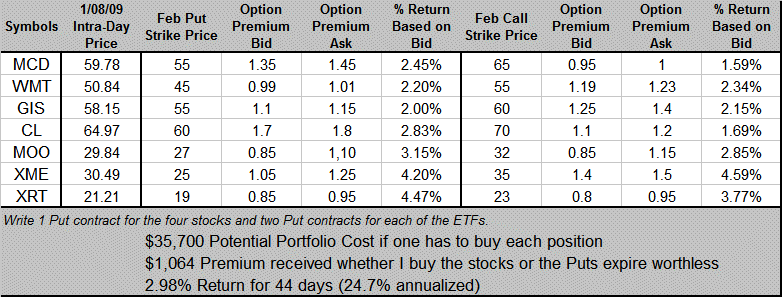
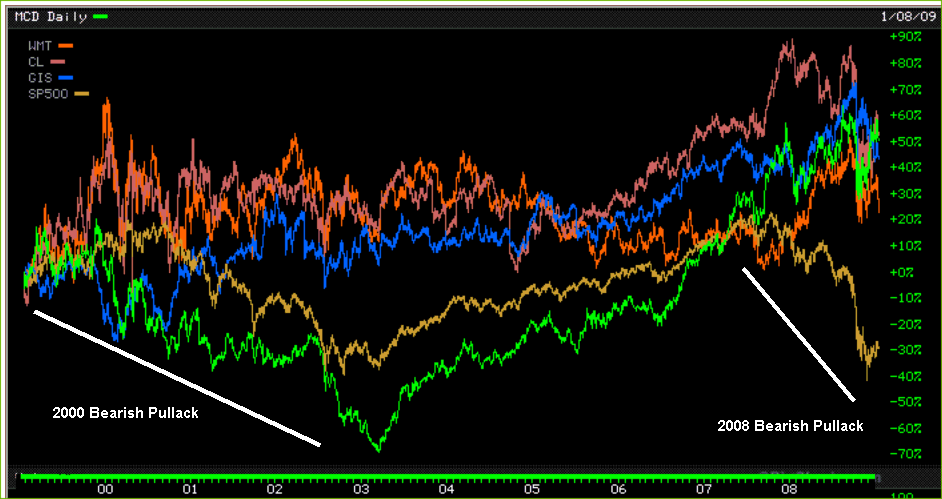
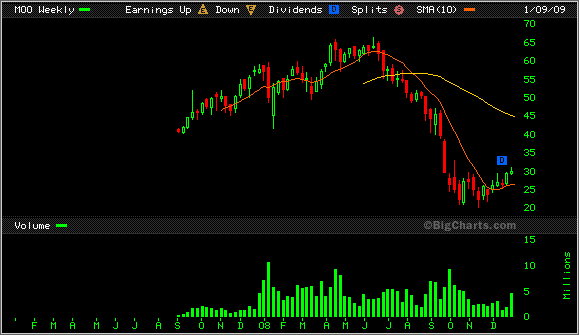
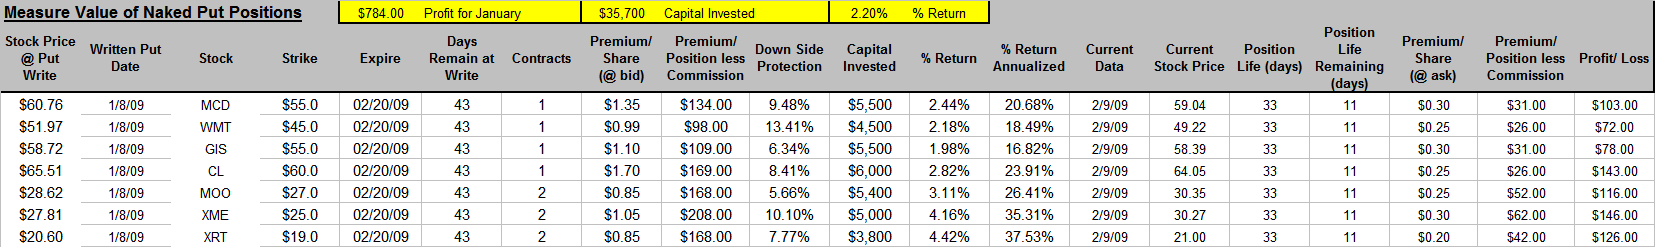
A Strategy for Greater Returns. Part I: The Naked Puts (01/08/09 - Updated 02/09/09) [TSM HomePage] In today’s economic times, six-month CDs return 2.9%, six-month treasuries 0.3%, ten-year treasuries 2.5% and triple A corporate bonds 4.8%. To add some perspective, if you had a million dollars to invest in one of these vehicles and hoped to live off that income, their annual return would provide $29,000, $3,000, $25,000 and $48,000, respectively, and this would hardly would be enough to live on, even for this millionaire. So, unless you wanted eat into your principal or to add income by working as a Wal-Mart greeter, a higher income strategy is needed, preferably one that’s conservative enough to be used in an IRA and, at the same time, one that carries less risk than just owing stock positions outright (and hoping they'll go up). One option strategy meets these requirements: selling (or writing) naked, deep in-the-money Puts. Writing the Naked Put Most of you probably know that a Put gives the buyer the right (but not the obligation) to put his stock shares to the seller at the Put’s strike price at any time up to the Put’s expiration date. In effect, the writer of the Put provides an insurance policy to the owner of the stock shares. For example, if you paid $55 a share for 100 shares of Wal-Mart, and you’re worried that the market was ready to take a hit, you might buy a $50 Put for ~$1.00 that expires in one month. One contract covers your 100 shares and guarantees you that your shares cannot fall below $50 over the next month, i.e., even if the shares fell to $10, you could still put the shares to the seller of the Put for $50. You’re effectively buying insurance, while the person writing the Put is the insurance company, and insurance companies win this proposition more often than not. That's why Warren Buffet is in the insurance business. But always remember, catastrophes happen and insurance companies can lose big time, e.g., hurricane Katrina; similarly, the market can take a hit too, e.g., 10/19/87 when S&P fell 20.5% in one day. Let’s consider a specific example because option strategies (like statistics and math in general) are best learned through example. Assume I have $35,700 to create my portfolio, and my goal has two parts: first, I want to earn at least 1.5% monthly (18% annually), and second, I want to build a portfolio of stocks purchased at bargain prices. For purposes of this discussion, I have eliminated commission costs. For me, using TradeStation as a brokerage, the one-way transaction costs are $1 per 100 shares or $1 per option contract (after a $100 charge per month for their platform which is waved if 5,000 shares or 50 contracts are traded during the month) so these costs are insignificant. This first table shows selected Put and Call options that were available on Thursday, 01/08/09 for four large conservative stocks (McDonalds, Wal-Mart, General Foods and Colgate) and three Exchange Traded Funds (Agribusiness (MOO), Metals & Mining (XME) and Retail (XRT)). The stocks were chosen because they have large market caps and have historically performed well in down economies (see chart below). Wal-Mart, for instance, is the low-cost supplier of most everything they provide so they will be the last one standing in tough economic times. Note, while MCD fell with the market in 2000, it’s performed well in 2008. The chart shows how each of these stocks and the S&P 500 has performed over the past decade. The ETFs were chosen because their weekly charts show they are rebounding from a bottom supported by their respective rising 10-week moving averages. They were chosen from the 269 ETFs that averaged trading at least 100,000 shares daily over the past 50 days. Further, their respective bid/ask spreads were less than 40 cents. The weekly chart of MOO is provided below as well.
Consider MCD as an example. While trading at $59.78, I could have sold the Feb $55 in-the-money Put for its $1.35 a share premium or $135 a contract. This short Put would then obligate me to buy someone’s 100 shares at $55 a share at anytime between today and the third Friday in February. Notice, that’s a bargain price relative to buying the shares immediately at $59.78 per share (intra-day 1/08/09). Selling the Put and then having the MCD shares put to me over the next month would cost me $53.65 ($55 minus the $1.35 premium). While it's true, if MCD had dropped to $50, I would have lost money, you tell me, who would lose more money, the owner of the shares ($9.78 per share) or the seller of the Put ($3.65 per share)? It's far more likely that the MCD shares don't fall below $55 during the month, and for providing the insurance, I immediately receive the $135 premium, a 2.45% return on the $5,500 ($55 x 100 shares) that’s then frozen in my account until the option position expires worthless, is executed, or is further traded by me (I can buy it back at any time up until expiration).
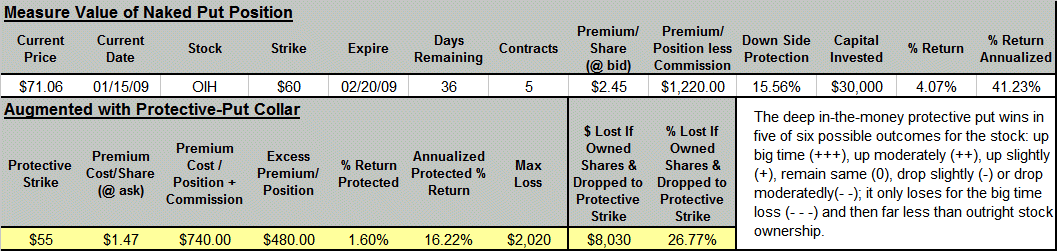
If I sell one Put contract for each of the four stocks and two contracts for each of the ETFs (to balance dollars invested with the requirement to trade 100 share contracts), my $35,700 will have generated $1,064 in option premium (a 2.98% return for 44 days invested or a 24.7% annual return). In a bullish environment, I probably wouldn’t get a chance to buy any of the seven components of my portfolio at bargain prices. Instead, I would keep the premium then repeat the process—perhaps with different stocks—during the fourth week of February. In a bearish market, however, I might well end up owning half or more of the components but each one would be purchased at a bargain price. There you have it, writing naked out-of-the-money Puts is a strategy that easily provides 15-30% annual return and allows one, at the same time, to build a portfolio at bargain prices. This Naked Put strategy is so conservative that it can be executed in most IRA accounts. The downside risk is better than owning the stock outright, though one can still lose money, just not as much as the stock owner. Of course, there is a second risk with these type strategies (naked Put and Covered Call). One also can lose out on the big gainer, e.g., APOL's +$8.05 move on Friday (1/09/09). If the underlying stock makes a large bullish move, it won't be put to you (naked Put strategy) or you will be forced to sell it at a lower price (covered Call strategy). Naked Put with Protective "Collar" (01/15/09) I thought that a few more examples might prove helpful, and I wanted to add the professional wrinkle to this strategy. Most professionals protect (hedge) their positions against catastrophe. In the case of our naked Put strategy, the hedge is to limit our potential loss by buying a protective Put at the next lower strike price. Consider the OIH ETF.The following Table details the particulars of the OIH Naked Put trade. OIH was trading at $71.06, and at that time, five contracts of its Feb $60 Put could have been sold naked to generate $1,220 (note, here I've subtracted the $1 per contract commission) in premium income, and $30,000 would be frozen to cover the potential buy. This represents a 4.07% return for the 36 day position (41.23% annualized) with 15.56% downside protection. Worst case scenario, OIH drops below $60, and I'm put the shares at a 15.56% discount to what I could have purchased them on day one. Note, while it's true that I could always limit my loses by employing a stop-loss strategy that requires me to close the Put (buy it back) should the price of OIH drop below some technical support, these deep in-the-money positions are really at risk only to the catastrophic fall which, unfortunately, usually occur overnight when stop losses won't help.
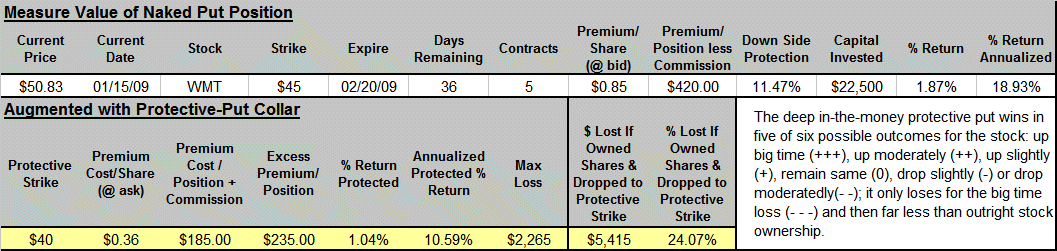
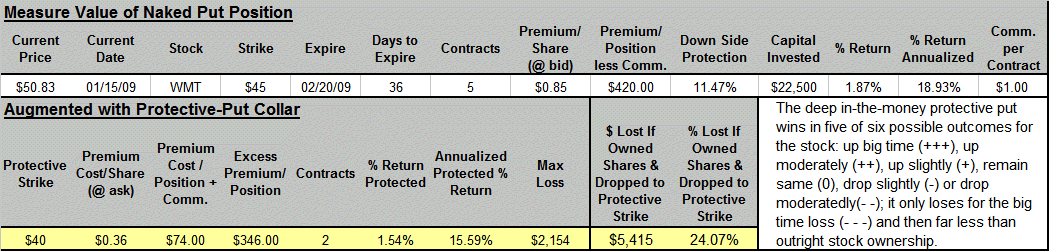
The naked Put position can be protected by buying the Put at the next lower strike, here the $55 strike at a cost of $1.47 premium. This effectively reduces my total premium to $480 (from $1,220), but that's still a 1.60% return for the 36 days (16.22% annualized). Further, it limits my loss to $2,020 even if OIH were to fall to zero over the same time period. This effectively collars my potential loss (creating a spread trade) and continues to give me a good return. As shown in the table, the trade is profitable over six of seven possible scenarios and protected against the sixth. Let's now look at a more conservative example, WMT, in the following chart. There's an 18.93% annualized return with 11.47% downside protection without the protective collar which drops to a 10.59% return with the protection. While I'm inclined not to give up so much for the protection (the lowest WMT's been this decade is 41.5 split adjusted), I'm not sure either that I want to experience a price drop to $20 (a $25 per share loss) after a catastrophic event. One compromise might be to buy protection on only two or three of the five contracts. The last chart shows that buying two protective puts reduces our annualized profit to a still respectable 15.59%.
Results 01/18/09 [after 1 Week] The following table show how this portfolio has changed after one week. The value of the portfolio hasn't changed, as all seven positions remain above their respective Put strike prices. The total premium, however, has increased by $284, i.e., if we wanted to close this position, it would be at a $284 loss. Bear in mind though, that's reflective of the impact of the price spread on these seven option positions, i.e., we sell the Puts at the bid but would be forced to buy them back, if necessary, at the higher priced ask. The value of this position will be realized as time starts to eat away at the value of these positions. 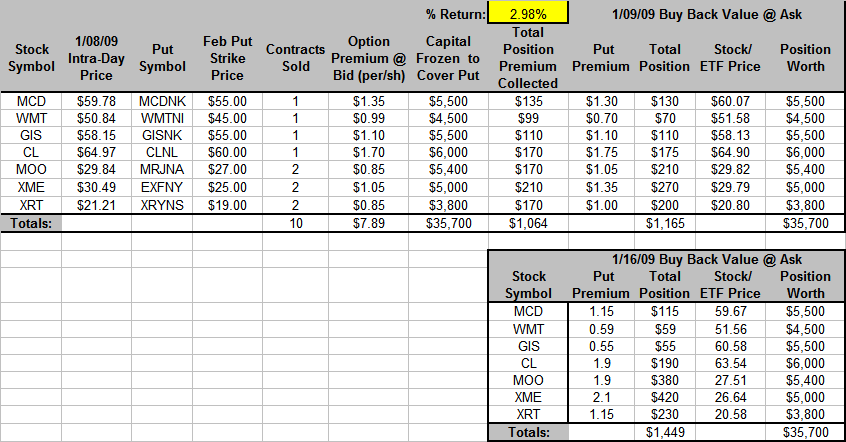 Results 02/09/09 [after 33 Days] The following table documents how this portfolio changed after 33 days. With 11 days to go before expiration, I closed the portfolio for a $784 (2.20% return) profit. All seven positions were profitable. This is the most likely outcome one can expect from selling a deep, in-the-money Put. If someone needed $6,000 monthly income, that could be achieved most months with a $325,000 lump sum using these strategies. By contrast that amount would generate $677 monthly in invested in 10-year treasuries.
| |||||